![]()
![]()
 Arion de Castro Kurtz dos Santos
Marcelo Resende Thielo
Ana Alzira Kleer
A brief account of Environmental Education in Brasil It is claimed that the environment must consider both in its natural and man-made aspects. Also, Environmental Education must be interdisciplinary, examining the main environmental issues, focusing on current situations. Many educational environments and methods can be used, and the environment must be treated as a real system, under a systemic emphasis, considering different temporal dimensions. The environmental question has been mainly treated under natural and technical dimensions, but it requires the search for new philosophical paradigms, including ethical questions which go beyond the scientific, technical, socioeconomic and political boundaries.
Environmental Education practice motivates an intense exercise of citizenship; in a country where democracy has just been established, it is easy to understand why Environmental Education has not developed further in Brazil. Now, with a flourishing democracy, we are able to discuss the necessity of forcing polluting sources to obey the country's environmental legislation.
The Project Teachers of the Physics Department at FURG (Fundaçăo Universidade do Rio Grande) - Brazil are developing a project which aims to improve the standard of Science Education in primary public schools through computer assisted learning. This paper reports part of the activities developed by the group.
My aim is to present a set of tasks related to reality which we are proposing to work with primary students and to discuss the potential of computational semi-quantitative modelling for Environmental Education in order to promote responsible citizenship.
VISQ Now I will make a brief description of a modelling program called VISQ3 which has been developed in cT and can be used in IBM-486 compatible computers and Macintosh Quadra 605. VISQ uses the neural networks mathematics to run causal diagrams on the computer screen. It gives a systematic interpretation to any causal diagram.
VISQ allows the creation of semi-quantitative models regardless of content, both in human and natural sciences.
VISQ tools
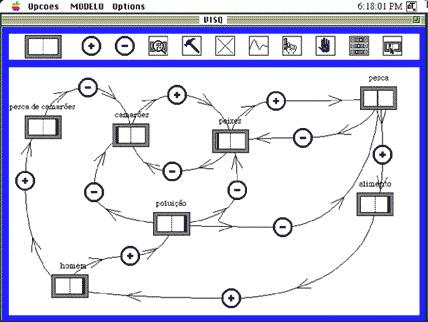
Figure 1
The main window of the program, in figure 1, shows the icons which are the program functions. To make your model you will have to use them, as explained below.
 This icon represents a variable or a constant. First you will put the pointer on the icon and click mouse down. After changing color, you can put the pointer where you want on the screen and press again mouse down. A box will appear, where you must write a name and press return. You can use as many boxes as you need.
 Positive and negative icons which represent the links that link the boxes. The links make possible to change weights as shown in table 1.
Table 1
 You can change the name of a selected variable. You can even write hypertext, with hot words, inside any box.
 This icon is used when you want to isolate one variable to observe what happens without it. You have to select the hammer and click over the box you want to lock. The model will run as if this variable did not exist.
 This icon has two functions: delete a box or a link and reset the model.
 To observe graphs of temporal evolution of any variable and phase diagram of a variable against the other.
 This icon is to run you model and also to run the graphical window.
 The hand stops the model and also the graphs.
 It makes possible to change speed, damping, time interval and scales of graphs.
 The last icon gives semi-quantitative initial values of dependent and independent variables of a model.
Frameworks of analysis of VISQ models
The framework, in figure 2, describes aspects of students’ models on three dimensions:
1) the nature of the entities invoked;
2) the nature and status of the links used and
3) the final structure of the VISQ model.
The framework, in figure 3, describes aspects of students’ models in which concerns the model’s coherence and the process of model building.
The networks in figures 2 and 3 follow the systemic network conventions in Bliss, Monk and Ogborn (1983). Selections are made from all systems following a bracket. One selection is made from a system following a vertical bar.
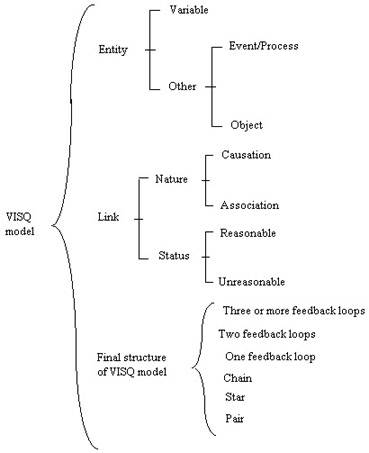
Figure 2
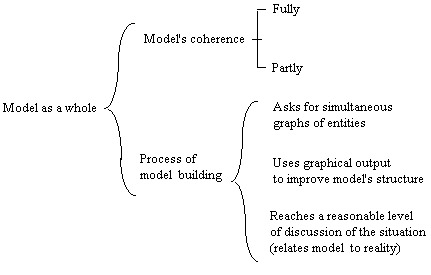
Figure 3
Classification of entities used
The network describes entities as
- variables or other. A variable is a box which represents a level or a rate of change. For example, population and number of cars are variables. Foxes, representing the number or population of foxes is also a variable. Velocity, which is a rate of change, is a variable.
As other than variables we have Event/Process or object. A Process is an action of some kind. For example, 'eating' is a process and it can be more or less intense or active, in other words, there is more or less of an action. Other examples are: burning fuel, eating grass and reproduction. An Event is something that just happens, for example, starting eating or stopping eating. It is localized in time and is not considered in terms of any sort of quantity. Examples of events are: car moves away, foxes die and rabbits survive.
It was not always possible to distinguish an entity as an event or process, in which case entities which could be considered as an event or process were put in one category named "event/process".
We have an Object when the "variable" is seen as a thing or a person. Examples of objects are: Bob (name representing a person), Earth and Man.
Kinds of links As an indicator of whether a link is reasonable or not in a VISQ model we have considered its nature and status. The framework uses Bunge’s ideas of directional/non directional and productivity, for analyzing the nature of the link as Causation or Association. The status of the link is also assessed as being reasonable or unreasonable.
A link is reasonable if it indicates the correct direction (production) or association between two entities and if it is correctly signed. A link is unreasonable if it indicates a wrong direction or association between two entities. It is unreasonable, as well, if it has got at least one unsuitable entity or has the wrong sign. The judgment about what should be considered a correct/wrong direction/association, a wrong sign and an unsuitable entity will depend on the situation being modelled.
Reasonable links can be composed of variables, events/processes and objects as well, but have to make sense. For example, both the links
rabbits ---------> + foxes
and
number of rabbits --------> + number of foxes
could be considered reasonable, even though the first link might be interpreted as composed only of objects, and the second of variables.
Final structure of VISQ model The structures of the models produced were analyzed in terms of the number of feedback loops, chains and pairs. Students who used at least one feedback loop, with reasonable causal links, composed mainly of variables, in principle, were identified as possibly thinking at a system level.
Amongst the models which had no feedback loop, it was possible to order structures as one pair, mainly star and at least one chain, see structures in figure 4 below.
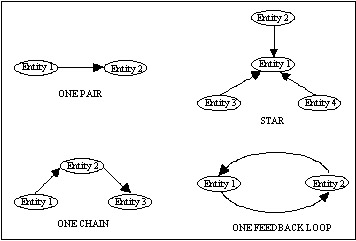
Figure 4
Models were also analyzed as a whole in terms of coherence. We have classified them as fully or partly coherent. Fully coherent received 1 and partly coherent 0. The model building process was analyzed through observation of the student-computer interaction mainly in terms of use of simultaneous graphs of entities, use of graphical output to improve the model’s structure and level of discussion reached by the student in which concerns ‘reality’, which is related to the promotion of responsible citizenship.
The Sample The project has been working with 11 to 18 years old students, with an average age of 14.3 years old, from a school located in a very poor area of the city of Rio Grande (see table 2). These students have never worked with a computer before.
| NAME | AGE | CLASS | GENDER | SCORE |
| Rafael Mann | 14 | 6 | M | 5.5 |
| Aline Quadros | 12 | 6 | F | 4.9 |
| Carla Rocha | 13 | 6 | F | 6.5 |
| Gilson Borges | 16 | 6 | M | 6.4 |
| Fabiana Arnold | 15 | 6 | F | 6.5 |
| Diego Rodrigues | 11 | 5 | M | 4.5 |
| Alan Mendes | 15 | 5 | M | 4.6 |
| Daniele Lemos | 13 | 5 | F | 5.6 |
| Ana Rodrigues | 13 | 5 | F | 6.2 |
| Vagner Lemos | 11 | 5 | M | 4.4 |
| Edir Lourenço | 13 | 5 | M | 2.8 |
| Marcelo Alves | 16 | 5 | M | 4.0 |
| Vanteir Duarte | 16 | 6 | M | 6.4 |
| Rudines Marx | 17 | 6 | M | 6.5 |
| Radames Marx | 18 | 6 | M | 6.7 |
| Gilson Bandeira | 16 | 6 | M | 5.2 |
The first task was presented by a comic strip of a child that should take a shower and keep clean. The second was also a comic strip of a little Indian that is trying to fish in a polluted river without fish because of a polluter monster which is a plant. This comic strip is followed by a text about "pollution in our industrial city" taken from a local newspaper. There are also two activities one presented by an "ecological poem" and the other about "bats". The final activities were presented by texts also taken from local newspapers about "recycling litter", "Rats population explosion" and "Fishing of irregular size prawn in Southern Brazil". Here, to show results, graphs will be presented as ComicsClean, ComicsEnvironm, Poem, Bats, Litter, Rats and Prawn.
After learning the VISQ tool, students were asked to think about the real situations, and express themselves with the tool. Each student have worked, once in a week, in four meetings of 3 hours each using the computer.
Examples of models developed by students for each task Here I present one example of each kind of model developed by students for the proposed tasks. When the model runs it is possible to see the vertical level moving continually inside the boxes.
In general the models composed mainly of variables are very good with a noticeable number of feedback loops. The only exception was the model for "recycling litter" (figure 5), with mainly a chain and just one feedback loop.
Keep clean
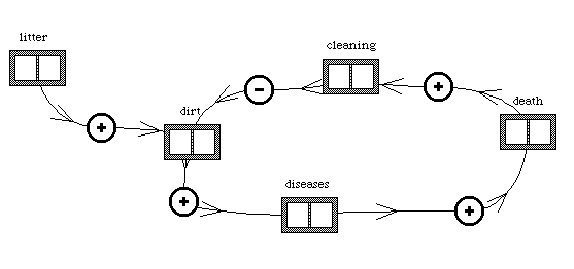
Figure 5
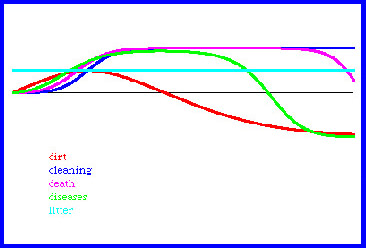
Figure 6
Pollution in our industrial city
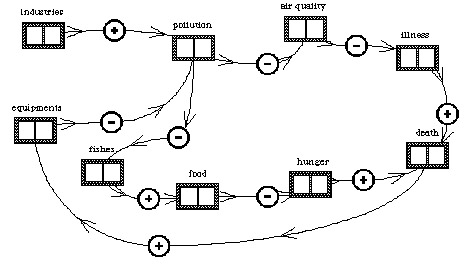
Figure 7
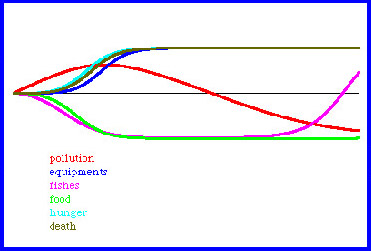
Figure 8
Ecological poem
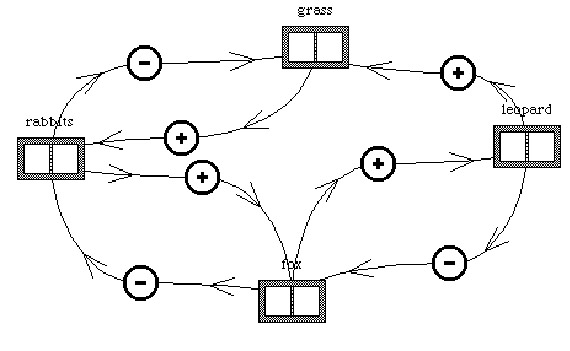
Figure 9
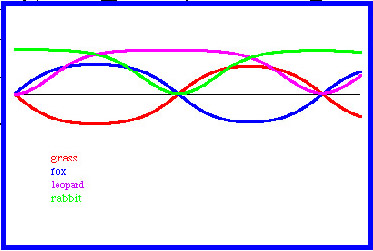
Figure 10
Bats
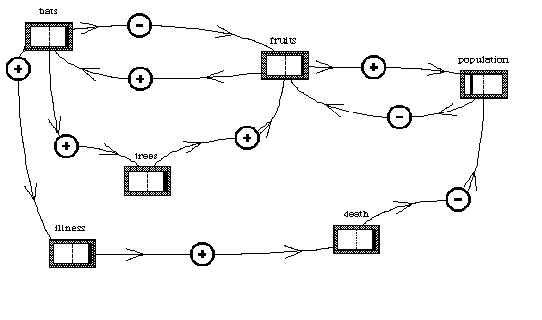
Figure 11
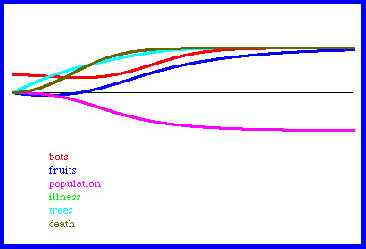
Figure 12
Recycling litter
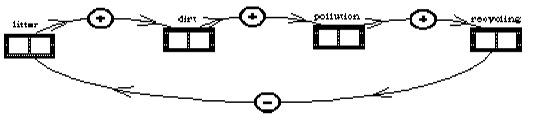
Figure 13
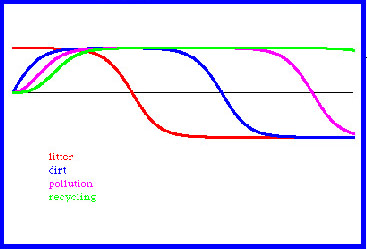
Figure 14
Rats population explosion
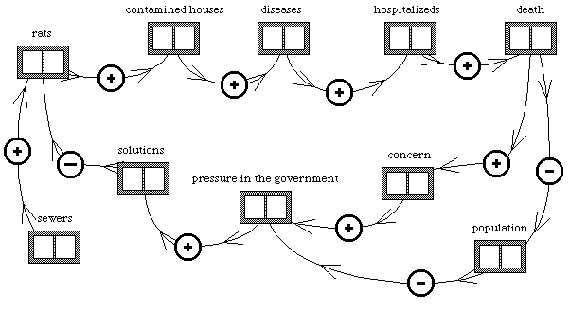
Figure 15
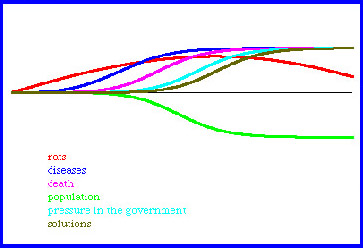
Figure 16
Fishing of irregular size prawn in Southern Brazil
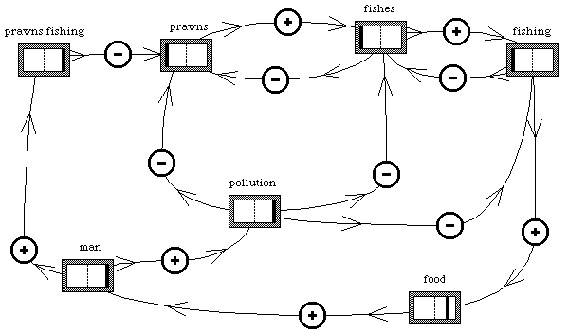
Figure 17
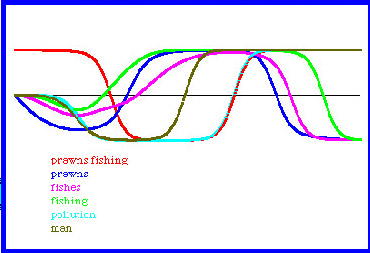
Figure 18
Main Results
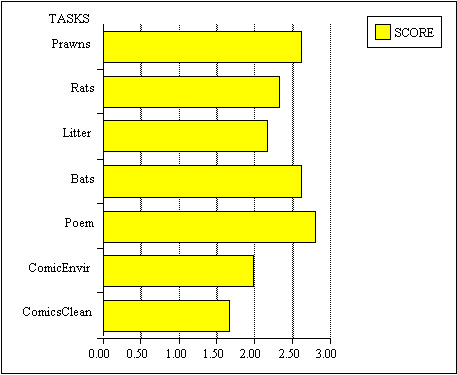
Figure 19
A general score (maximum 3) was constructed considering the number of variables, reasonable causal links and feedback loops used. With this score was possible to classify as the best activity (see figure 19), the one about the "Ecological Poem", followed by "Bats" and "Prawns". The tasks about comic strips had lower scores maybe because they were the first ones in the instructional material.
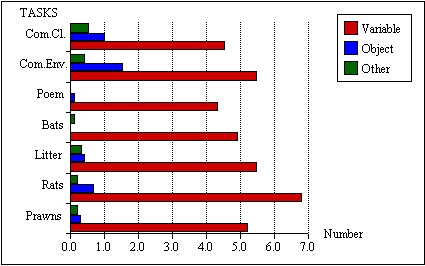
Figure 20
Figure 20 shows that in general students developed models composed mainly of variables with very few "other" (events/processes and doubtful). There is an average maximum number of less than two objects for the comic strip task about environment.
Examples of other (events/processes and doubtful) and objects are: angry, friend, beautiful, river, boot, monster, nature, sewer, cities, seas and planting.
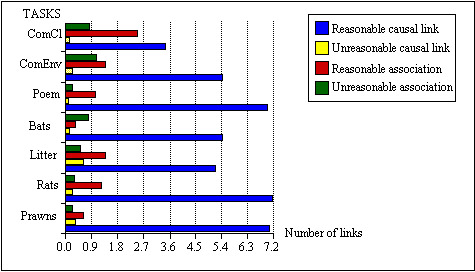
Figure 21
Figure 21 shows that the causal links used were mainly reasonable, being followed by a low number of reasonable associations. Unreasonable causal links and unreasonable associations were rare.
Exemples of unreasonable causal links are: fishes increases prawn; health decreases people; trees increase pollution; litter decreases recycling; fishing decreases fisherman; population decreases litter and litter decreases rats.
Examples of reasonable associations are: fox increases grass; leopard increases grass; sewer increase litter; recycling increases money and cleaning increases love.
Examples of unreasonable associations are: seas decreases prawns; seas decreases fishes; man increases indian and litter increases boots.
A further analysis showed that events/processes, objects and doubtful entities tended to make part of unreasonable causal links and associations. Chains were used mainly with reasonable causal associations and variables were used mainly with reasonable causal pairs and feedback loops.
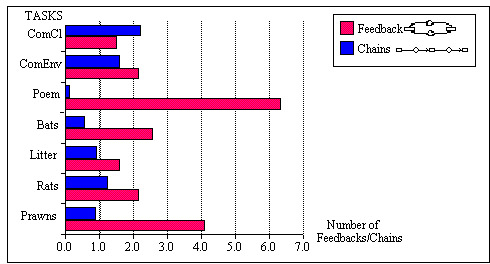
Figure 22
In general students have used at least one feedback loop in any of the tasks, which is considered a positive aspect. The total average number of feedback loops in figure 22 was noticeable, since there is a minimum average number of about more than one loop for the "comics clean" task and a maximum average number of more than six loops for the "ecological poem" task. The "prawns" task has an average number of about four feedback loops.
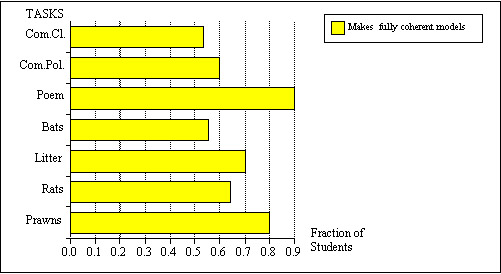
Figure 23
Figure 23 shows that the models in general tended to be coherent for all tasks, with more than half of the students building fully coherent models in all tasks. The models tended to be fully coherent for "poem" and "prawns" tasks, with more than 70% of the students. About half of the students developed coherent models for the "comic strip" situations and for the "bats" task.
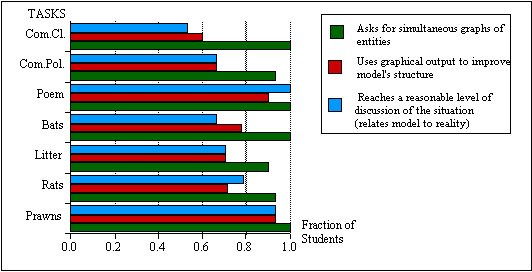
Figure 24
Figure 24 shows that students during the model building process asked for simultaneous graphs of entities and tended to use the graphical output to improve model’s structure. Also, more than half reached a reasonable level of discussion of the situations, relating model to reality. Observation showed that students discussed a lot the proposed situations reaching an argumentation level that they did not have before.
Conclusion Results suggest that in general the instructional material was capable of promoting system thinking.
We hypothesize that the students is able of system thinking :
- when s/he uses variables in reasonable causal links, in fully coherent models with at least one feedback loop;
- when, during the building of the model, they have to ask for simultaneous graphs of variables, using the graphical outputs to improve the model structure, reach a reasonable level of discussion of the situation studied, and relate the model to reality.
Results suggest that the VISQ program is suitable for introducing students to Computer Science
Thanks to VISQ, after their first exposure to the program, poor students, who have never worked with a computer before, were able to demonstrate competence in some abilities related to modern computational systems.
VISQ allowed students to be introduced to some of the Principles of Systems such as the idea of cause-effect pairs, negative and positive feedback loops and the corresponding graphical output.
Results suggest that the program VISQ is suitable for use in Environmental Education.
VISQ makes it possible for students to work with many variables which represent biological, social and economic aspects of some situation. This is why the program is suitable for working with complex systems in a semi-quantitative way.
After working with the set of tasks, students started to become aware of some environmental issues, going towards more responsible citizenship.
We expect that they make use of this knowledge to undersntand their roles as agents that can transform society, heading for a more responsible citizenship.
While observing the model running on the computer screen, students discussed and came to their own conclusions. Such interactions promoted a better understanding of the situations studied, as well as the critical thinking about environmental issues.
Bibliography Bunge, M. (1963) Causality and Modern Science. Dover Publications, New York.
Forbus, K. D. (1985) The Role of Qualitative Dynamics in Naive Physics. In Formal Theories of the Commonsense World, (eds. J. R. Hobbs & R. C. More). Ablex Publishing Corporation, New Jersey.
Forrester, J. M. (1968) Principles of Systems. Cambridge, Wright-Allen Press Inc, Massachusetts.
Kurtz dos Santos, A. C. & Ogborn, J. (1992) A Model for Teaching and Research into Computational Modelling. Journal of Computer Assisted Learning. vol.8, No.:2, 67-78.
Kurtz dos Santos, A. C. (1992) Computational Modelling In Science Education: A Study of Students’ Ability to Manage Some Different Approaches to Modelling. Institute of Education University of London. Unpublished PhD thesis. 359p.<>p Kurtz dos Santos, A. C. & Ogborn, J. (1994) Sixth form students' ability to engage in computational modelling. Journal of Computer Assisted Learning. vol.10, 182-200.
Mellar, H. et al. (eds) (1994) Learning with Artificial Worlds: Computer Based Modelling in the Curriculum. The Falmer Press, London .
Miller, R. S., Ogborn, J., Turner, J., Briggs, J. H., Brough, D. R. (1990) Towards a Tool to Support Semi-quantitative Modelling. In Advanced Research on Computers in Education (eds. R. Lewis & S. Otsuki). North Holland, Amsterdam.
Appendix - Instructional Material
![]()
 BACK
BACK